It’s the middle of January which means that every team in the American Hockey League has completed at least a half season of hockey. There’s been some teams that have improved, some that have remained consistent, and some that have stumbled. There’s a lot of hockey left to be played and anyone who follows this league knows that it can all change within a few weeks.
The only thing these numbers point out are wins and losses. They don’t factor in injuries and call ups that can have a big impact on a team. For anyone looking for general AHL numbers feel free to keep scrolling.
The only team that I can speak to is the Rochester Americans (the focus on this site) where the month of November when the team finished with a 8-0-1-1 record compared to the current 3-7-0-2 slump. Trying to pinpoint the reason for the sudden struggle has been a challenge. The narrative of losing players is negated by the fact that players were also added.
I always like to point out that I cover the team throughout the season, this is by no means a panic, or stating the season is over. That’d be impossible to do when the team still has a .632 winning percentage and based on that finished tied for first place in the North at the half way point of the season. It’s about covering the ups and downs.
Here’s some key names comparing the two trends.
November w/ 8-0-1-1 record:
- Curtis Lazar (3G) only played in 3 of 10 games in November.
- Rasmus Asplund (1G+2A) only played in 4 of 10 games in November.
- Tage Thompson (2G+1A) played in 6 of the 10 games in November.
- Lawrence Pilut (1G+6A) played in 9 of 10 games.
- Andrew Hammond was 4-0-1.
- Jonas Johansson was 4-0-1.
In the last 12 games (3-7-0-2) slump:
- Lawrence Pilut (3G+4A) played in 8 of the games, only missing the last 4.
- Casey Mittelstadt was added to the roster (4G+3A) and has played in the last 12.
- Remi Elie (1G) played in the last 7 after returning from injury.
- Taylor Leier (5G+1A) returned from injury playing in 7 games before another injury.
- Andrew Hammond is 0-6-0.
- Johan Johansson is 3-1-1.
- Ukko-Pekka Luukkonen is 0-0-1.
The line that they’ve lost players is cancelled out by the fact that they also added players. The biggest difference? Goaltending. Is it all directed at goaltending? Or did Gord Dineen get more out of the group of players as interim coach? That’s a line that could get me in trouble but as part of writing you put out all of the scenarios.
There’s a lot of hockey left to be played. Time to look at the league wide numbers after half a season.
A half is considered 38 games (19 games a quarter) for teams in the Atlantic, Central, and North Divisions. The Pacific Division a half season is considered 34 games (17 games a quarter).
Again, so much can change in the American League on a week to week basis. These are observations at this point and will be more interesting to look at after the regular season is over followed by playoff success to see if any of this had a direct impact.
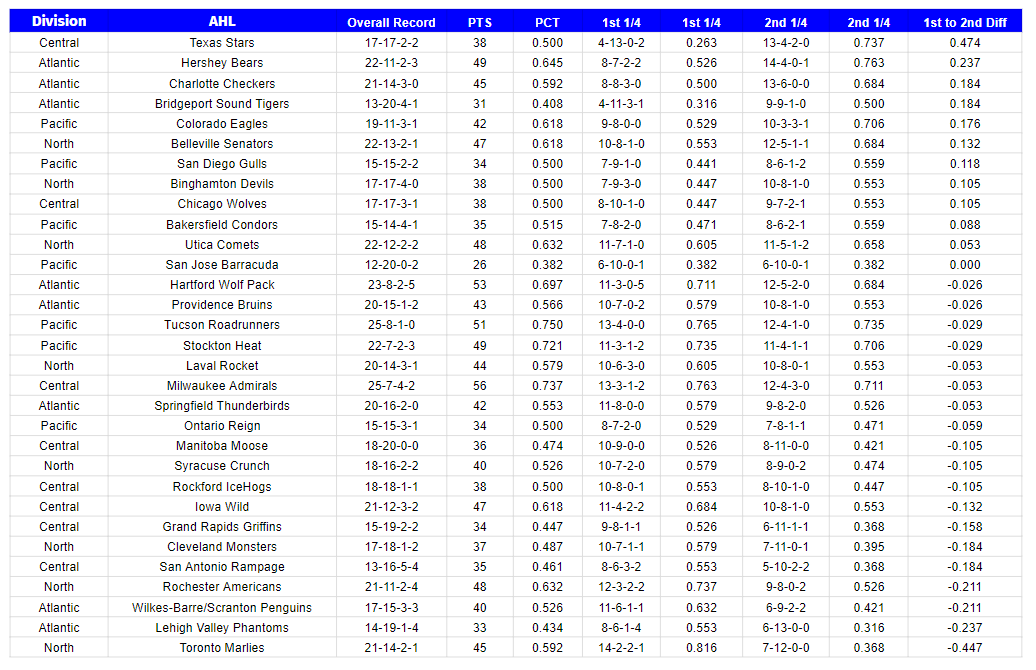
This first chart is the entire league ranked by the difference in winning percentage from the first quarter of the season to the second quarter. The reason I did it this way was to show how teams like Texas, Hershey, Charlotte, Bridgeport, and Colorado were able to turn the start of their season around. You can also see how teams like Toronto, Lehigh Valley, Wilkes-Barre/Scrnaton, and Rochester hit a slump after a hot start.
2019/2020 First Half Ranked by Difference in Win Percentage from First Quarter to Second Quarter
These next two charts are how teams finished in conference standings overall based on winning percentage.
2019/2020 Eastern Conference First Half Standings Based on Winning Percentage
2019/2020 Western Conference First Half Standings Based on Winning Percentage
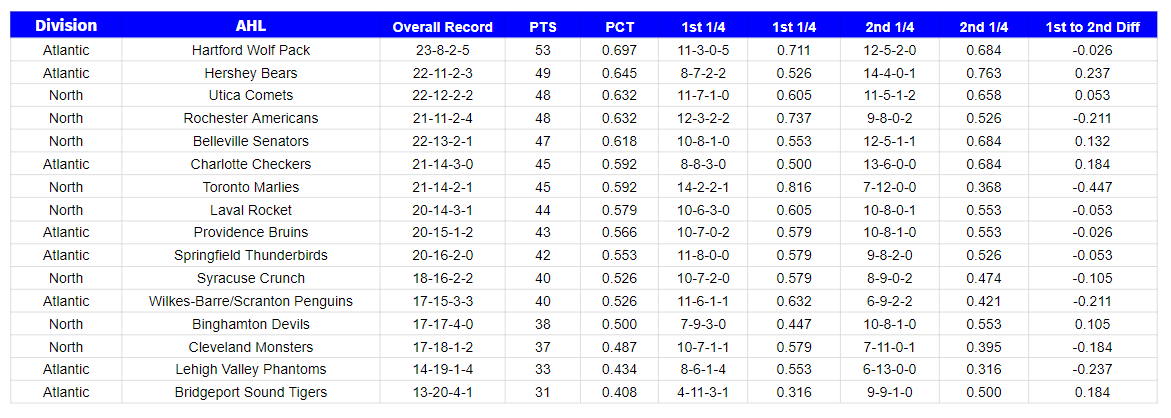
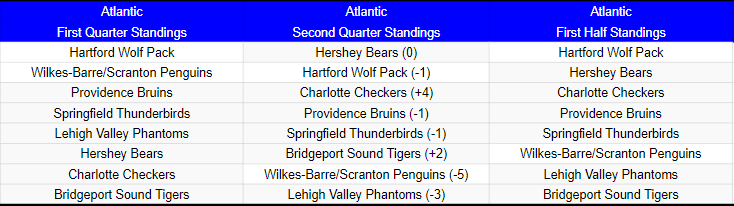
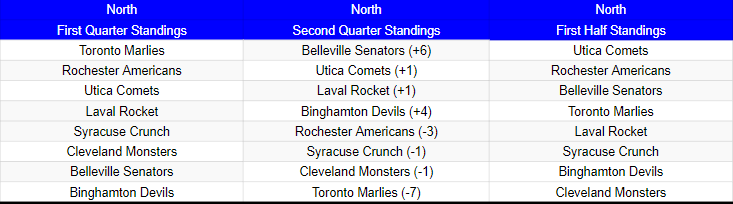
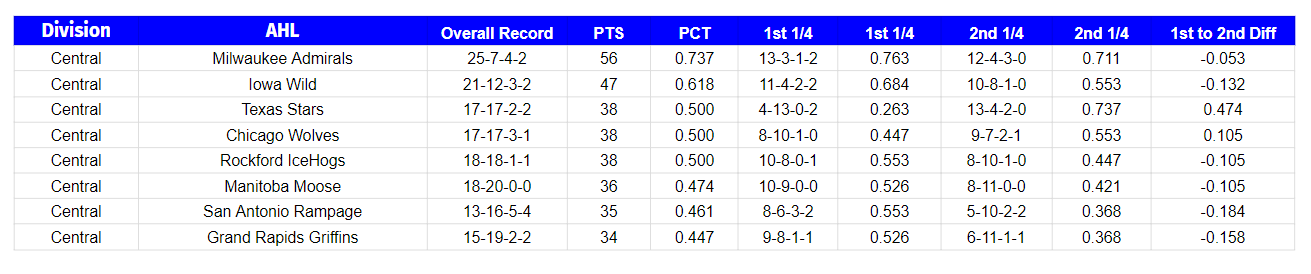
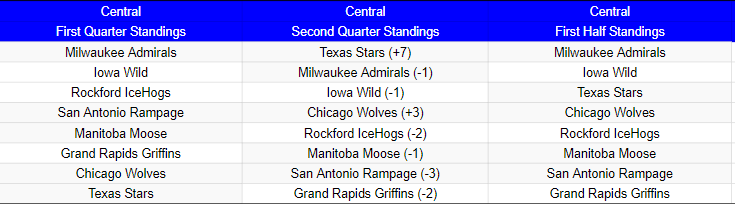
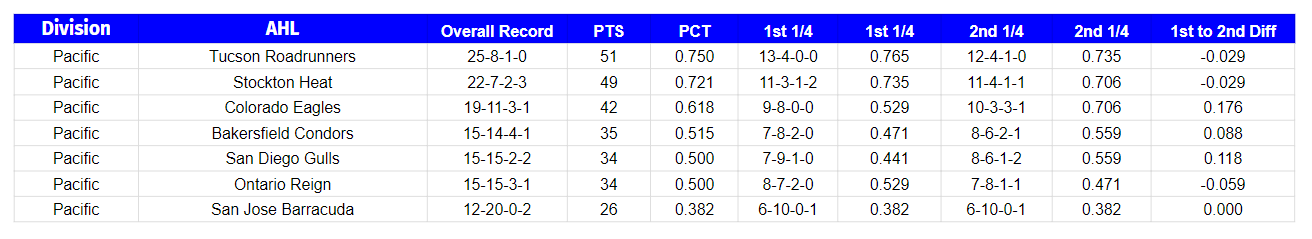
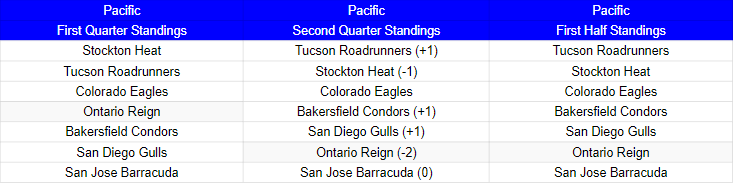
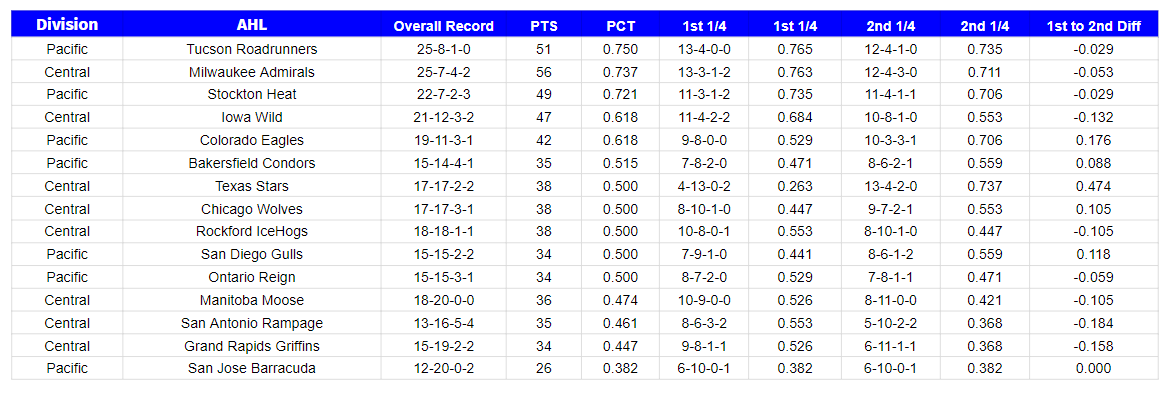 The next four charts are what the standings in each division look like based on winning percentage after 38 games along with where teams ranked at the first quarter, just in the second quarter, and where they are at the half way point. You can also see each teams difference from the first to second quarter along with the overall records.
2019/2020 Atlantic Division First Half Standings Based on Winning Percentage
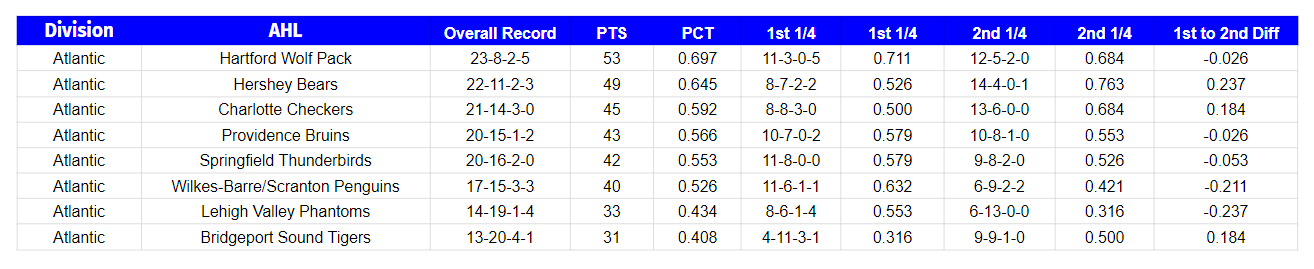
2019/2020 Atlantic Division First Quarter, Second Quarter, Division after the first half
2019/2020 North Division First Half Standings Based on Winning Percentage
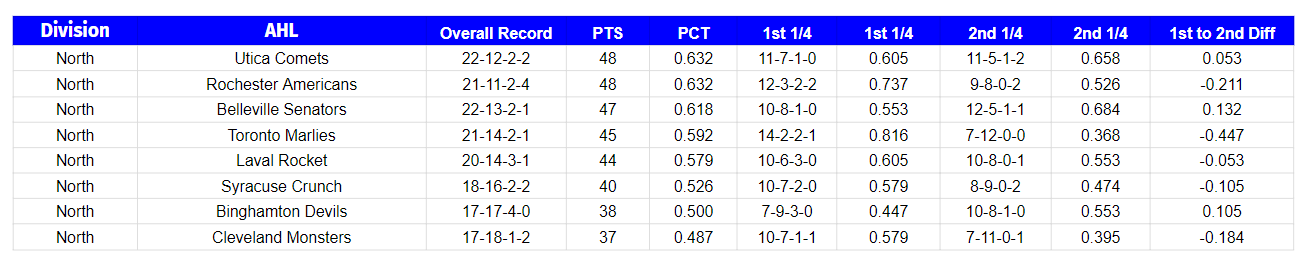
2019/2020 North Division First Quarter, Second Quarter, Division after the first half
2019/2020 Central Division First Half Standings Based on Winning Percentage
2019/2020 Central Division First Quarter, Second Quarter, Division after the first half
2019/2020 Pacific Division First Half Standings Based on Winning Percentage
2019/2020 Pacific Division First Quarter, Second Quarter, Division after the first half
For those who cover the league, feel free to use the charts as you like with a link. I’ll cover these same stats at the end of the regular season. All of this was compiled and is accessible in Google Sheets. If there’s any miscalculations please leave a comment, at me on Twitter via @LetsGoAmerks, or send an email to keith at letsgoamerks dot com.