There’s always teams throughout a league that are hot all season, cold all season, get better, stay the same, and some that decline. A great start can set a team up for a decline but a poor start can also hurt a team trying to get caught up. I took a look at the records of all 31 teams in the American League and used Christmas as a before and after. Why Christmas? Teams often consider that a break of sorts and with less than a quarter of the season left right now it worked as a general breaking point.
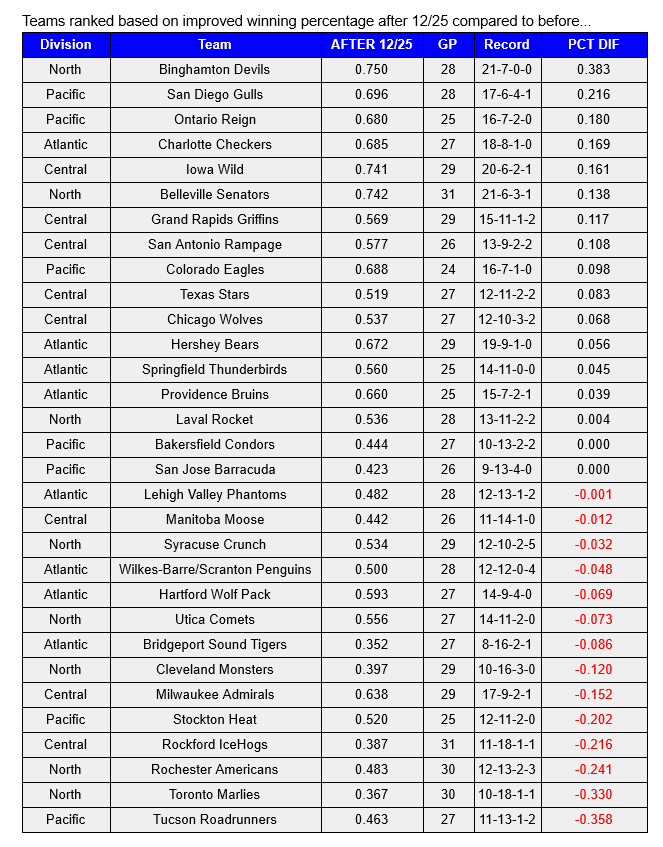
Based on the differences in winning percentage before and after Christmas there’s teams like Binghamton, San Diego, and Ontario that have improved and then teams like Rochester, Toronto, and Tucson that have had a major decline. Toronto went from a top team to currently being out of playoff position where Binghamton went from being at the bottom to being in the hunt for a playoff spot.
Everything is ranked based on winning percentage due to current differences in games played by teams along with the Pacific division still playing less overall games. There’s factors that play into every teams wins and losses whether it’s due to injuries, call ups, trades, or just performance in general. Do any of these changes in positions and winning percentages mean anything come playoff team? It’ll be interesting to find out over the next couple of months.
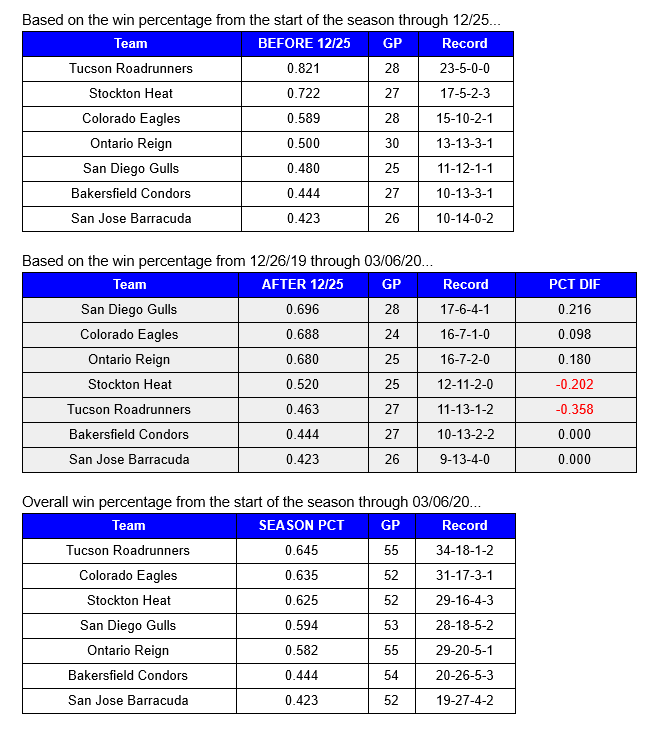
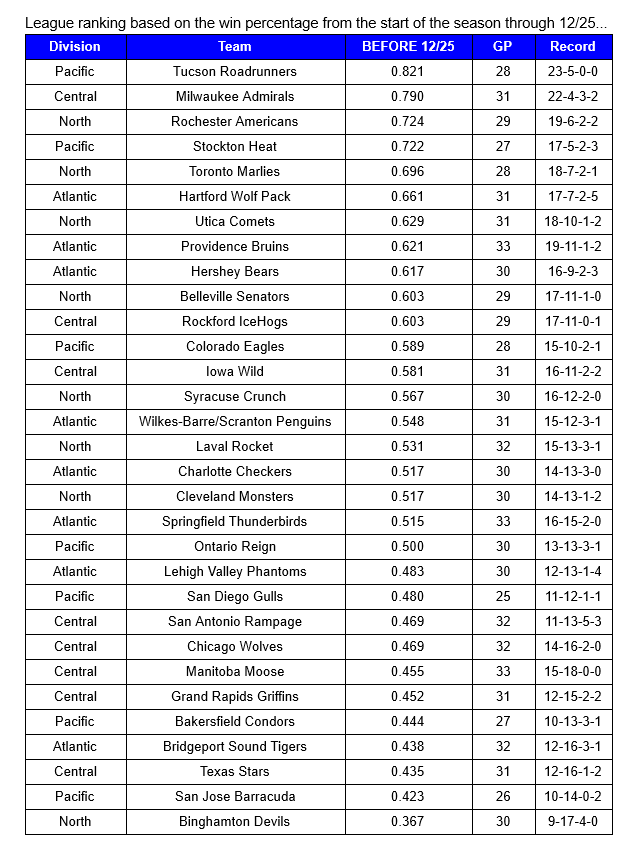
First let’s take a look at what teams were the best to start the season leading up until the Christmas break.
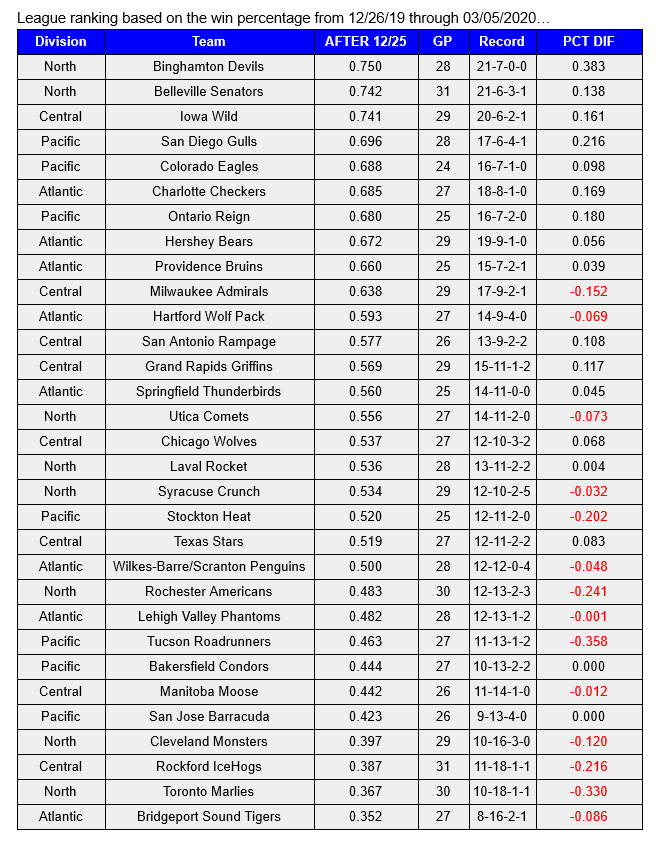
This next chart is based just on game between 12/26/2019 through the end of the day on 03/05/2020. The Binghamton Devils went from the worst team before Christmas to the best team in the stretch since Christmas.
This next chart is teams ranked based on the difference between winning percentages before and after Christmas. With Binghamton going from worst to first in that second stretch they’re clearly at the top. On the flip side teams like Rochester, Toronto, and Tucson had the biggest change in their winning percentage.
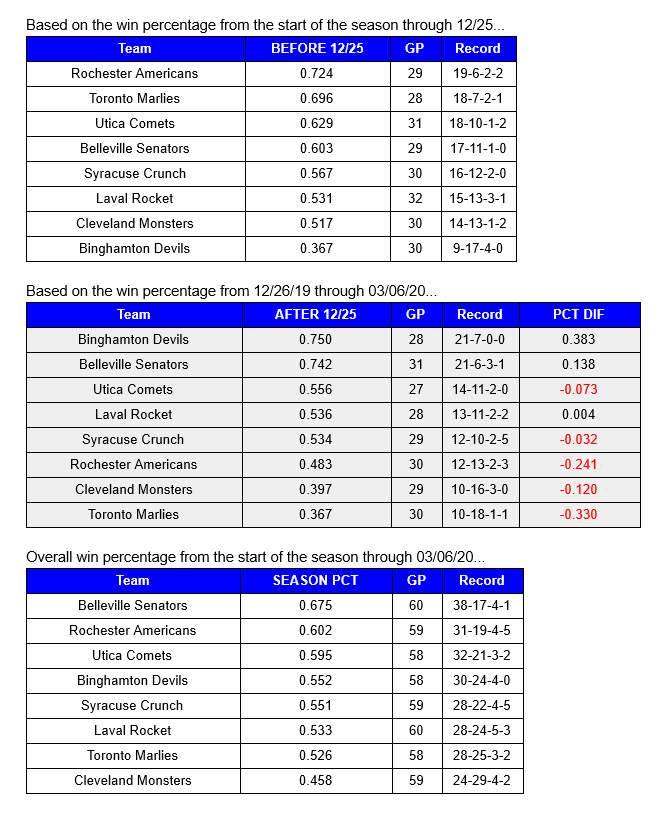
These charts below are based on each division. Where teams would be ranked before 12/25, in the stretch between 12/25 and 3/5, and where they actually are overall to see the differences. Everything is ranked based on winning percentage.
North Division
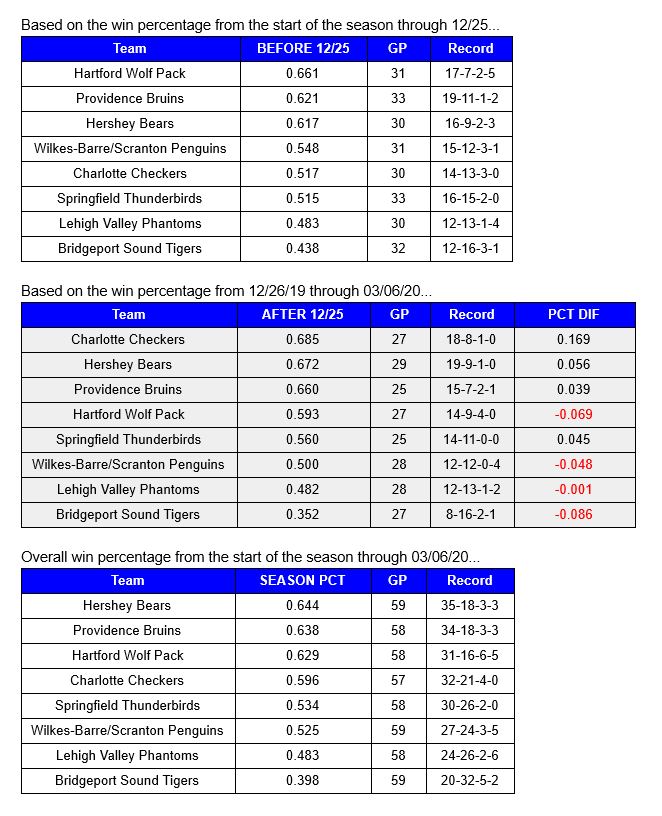
Atlantic Division
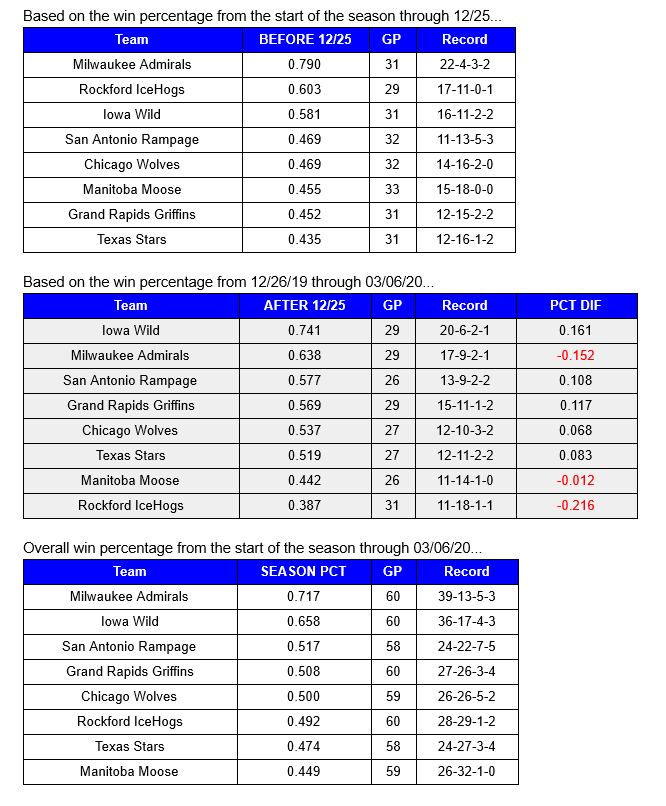
Central Division
Pacific Division